


Don't Build Blindly - Build Better with LangSmith
LangSmith, created by the LangChain team, is an observability and debugging platform specifically designed for generative AI workflows, though it can be used with other tools.
It enables developers to monitor real-time metrics, log detailed execution traces, and analyse past runs to understand system behaviour and troubleshoot issues.
Key features include performance evaluation, feedback collection, and cost tracking and the differentiation factor here is in providing tailored insights not always available in most of the generic monitoring tools.
It offers capabilities like trace analysis, replay, and dataset testing.
LangSmith aims to improve the reliability, performance, and cost-effectiveness of AI applications, and the same will be demonstrated with a customer support bot case study.
LangSmith-Debugging & Observability
Exploring LangSmith for Monitoring, Logging, and Troubleshooting Gen AI Workflows
Introduction
Let me introduce this by saying that this is one of the best tools that is useful for most of the team members in your LLM App team. I would say that 100% of your team can use this tool most of the time. It covers so much ground for your LLM App.
As generative AI applications become more complex, ensuring reliable performance in production is a critical challenge.
This is valid not only for dev team members but is equally valid for quality members of the product team or even engineering leaders who are not part of the day-to-day working team but are very interested in LLM apps' performance, efficiency, and cost.
Although it integrates seamlessly with LangChain, it’s principally built to be framework-agnostic and can also be used with tools like LlamaIndex or even custom Python code.
If I have to list down some of the key highlighted features, here is a list
Real-Time Monitoring
It is handy to keep track of latency, throughput, token usage, and error rates. And believe me these all features are itself a nightmare for your team in the critical juncture of your development cycle
Detailed Logging
It helps your team capture step-by-step execution traces (or "runs") of your AI workflows. alright so
It might sound ordinary, but believe me, as your LLM app gets complexity, this will be like oxygen to your team in a complex situation
Trace Analysis
Analyse completed executions, replay runs, and iterate on your prompt designs.
Evaluation & Feedback Collection: Build datasets of inputs/outputs, capture human feedback, and measure performance regressions.
Cost & Token Tracking: Monitor token usage to help estimate and control operational costs.
In this video, we’ll explore LangSmith’s key features, detail a practical setup and debugging workflow, review best practices and limitations, and conclude with a case study and call to action.
What is LangSmith?
LangSmith is part of the LangChain ecosystem, and it is designed for any LLM-based application.
Key functionalities include:
Monitoring:
Real-Time Metrics & Dashboards: Visualize latency, throughput, error rates, and resource usage.
Session & Project Tracking: Group runs by projects or sessions to compare performance over time.
Logging:
Detailed Execution Logs: Capture inputs, outputs, and errors at each step of your chain.
Traceability & Annotation: Correlate logs across steps; manually annotate or provide feedback to fine-tune outputs.
Export Options: Integrate with external monitoring tools like Prometheus or Grafana if needed.
Debugging (Trace Analysis):
Post-Hoc Trace Analysis: Instead of pausing live execution, LangSmith records traces that you can review to identify problematic inputs, latency spikes, or error sources.
Replay & Iterate: Replay past runs with modifications to validate fixes and improvements.
Datasets & Evaluation:
Automated Testing: Run chains over datasets to quantitatively evaluate performance and regression testing.
Cost/Token Tracking:
Operational Insights: Monitor token usage and associated costs, an essential feature for budgeting LLM operations.
Feedback Collection:
User Annotations: Capture user feedback (e.g., thumbs up/down, custom comments) directly on traces for continuous improvement.
Importance of Debugging & Observability in Gen AI Workflows
Generative AI workflows can involve multiple sequential or parallel steps, such as prompt generation, API calls, and memory retrieval.
These chains can produce unpredictable outputs or suffer from performance bottlenecks.
Robust debugging and observability allow you to:
Quickly Identify and Isolate Issues: Detect where a run deviates from expected behavior.
Optimize Performance: Lower latency and reduce error rates by fine-tuning individual components.
Continuously Improve: Use quantitative evaluations and user feedback to iterate on your models and prompts.
Control Costs: Track token usage and operational costs to maintain budgetary control.
LangSmith offers insights tailored to the unique needs of LLM workflows—something generic APM tools like Datadog or Honeycomb may not provide.
Practical Setup & Configuration
Installation
Install the required packages using the correct package names:
pip install langchain langsmith openai
Enabling LangSmith Tracing via Environment Variables
The easiest and most common method to integrate LangSmith with LangChain is to set the following environment variables. This automatically enables tracing without needing to pass client objects explicitly:
export LANGCHAIN_TRACING_V2="true"
export LANGCHAIN_API_KEY="YOUR_LANGSMITH_API_KEY"
# Optional: Configure your LangSmith endpoint and project name
export LANGCHAIN_ENDPOINT="https://api.smith.langchain.com"
export LANGCHAIN_PROJECT="Your-Project-Name"
Make sure to also set your OpenAI API key:
export OPENAI_API_KEY="YOUR_OPENAI_API_KEY"
Example Code Snippet
Below is an example that shows how LangChain components automatically log execution details to LangSmith via environment variables:
import os
from langchain.chains import LLMChain
from langchain.prompts import PromptTemplate
from langchain.llms import OpenAI

# With the environment variables set, LangChain automatically traces runs.
prompt = PromptTemplate(
    input_variables=["question"],
    template="Answer concisely: {question}"
)

llm_chain = LLMChain(
    llm=OpenAI(temperature=0, api_key=os.getenv("OPENAI_API_KEY")),
    prompt=prompt,
    verbose=True  # Console logging; separate from LangSmith tracing
)

response = llm_chain.run("What is LangSmith?")
print(response)
Note: This example assumes that environment variables for LangSmith are properly configured. For more advanced control (e.g., logging arbitrary data), you can use the LangSmith client directly:
import os
from langsmith import Client

client = Client(api_key=os.getenv("LANGCHAIN_API_KEY"))
# Use client.log(...) for custom logging if needed.
Debugging Workflow: Analyzing a Problematic Run
Scenario: A Customer Support Bot Returns Hallucinated Responses
Imagine a customer support bot that occasionally returns irrelevant or incoherent answers. Here’s how you can use LangSmith to diagnose the problem:
Examine the Traces:
Open the LangSmith dashboard and locate the run with unexpected outputs. Inspect the execution trace to see each step's input, output, latency, and any error messages.Analyze the Prompt Flow:
Review the prompt generation step to verify if the user input was correctly formatted. For instance, if the prompt "Answer concisely: {question}" isn’t receiving the expected variable, this might lead to hallucinations.Identify Latency and Error Metrics:
Check for any unusual latency spikes or error logs during API calls or memory retrieval steps.Replay & Iterate:
Although LangSmith doesn’t pause execution in real time, you can replay the run by modifying your code locally (e.g., refining the prompt) and then observing the new trace in LangSmith to confirm the fix.Implement a Fix:
Once the source of the error is isolated—perhaps an edge-case input or misconfiguration in the LLM call—update your prompt template or add error handling, and then retest to verify that the hallucinations are reduced.
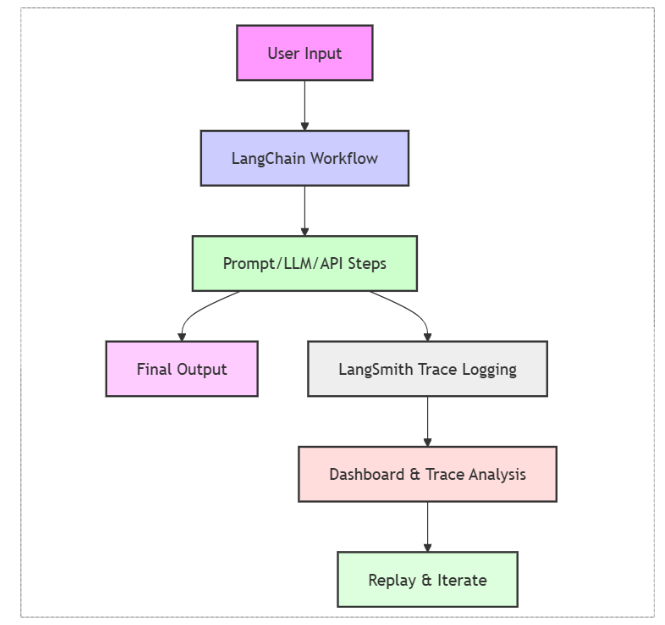
Visual: Simplified Debugging Workflow
Best Practices & Troubleshooting Tips
Modular Instrumentation: Log each component of your chain separately. This helps isolate issues when analyzing traces.
Set Alerts: Configure alerts for conditions such as latency > 2 seconds or error rates > 5%.
Log Granularity: Capture detailed inputs/outputs for every LLM call while filtering out PII.
Regular Trace Reviews: Periodically review your LangSmith dashboard to preemptively identify performance issues.
Leverage Dataset Testing: Run chains over a curated dataset to evaluate performance quantitatively.
Collect User Feedback: Use built-in annotation and feedback features to capture real-world performance insights.
Collaborate: Share trace dashboards with your team to facilitate collaborative debugging.
Additional Features & Considerations
Datasets & Evaluation
Automated Testing: LangSmith lets you run chains on test datasets and compare outputs against reference answers.
Quantitative Evaluation: Measure performance regressions and improvements using custom evaluation functions.
Feedback & Annotation
User Feedback Loop: Capture annotations, ratings, or comments on individual traces to improve prompt design and model behavior.
Annotation Queues: Curate runs that require manual review for further analysis.
Cost & Token Tracking
Cost Estimation: Monitor token usage for each run to help manage and predict LLM operational costs.
Operational Insights: Use these metrics to adjust model parameters and optimize performance.
Integration with Other Tools
Compatibility: While LangSmith provides tailored insights for LLM workflows, it can also integrate with external observability tools (e.g., Prometheus, Grafana) for comprehensive monitoring.
Async Support: LangSmith tracing works seamlessly with asynchronous code in LangChain.
What Makes LangSmith Different?
LangSmith is purpose-built for LLM workflows:
It understands LLM-specific constructs (prompts, tokens, chains) that generic APM tools might miss.
It offers integrated evaluation and feedback features.
Its trace visualization is tailored to the nuances of generative AI, providing deep insights into the model’s behavior.
Limitations & Considerations
Framework Integration: While designed for LangChain, LangSmith is not limited to it; however, out-of-the-box tracing works best with LLM-specific pipelines.
Learning Curve: Setting up and interpreting traces requires some familiarity with LLM workflows.
Cost Implications: High-volume logging and detailed trace capture may incur additional costs. Evaluate your usage accordingly.
Complementary Tool: LangSmith enhances, but does not replace, unit and integration testing frameworks.
Real-World Case Study: Debugging a Customer Support Bot
A financial services firm deployed a customer support bot using LangChain integrated with LangSmith. Initially, the bot experienced intermittent delays and hallucinated responses. By leveraging LangSmith:
Latency Improvement: The average response time dropped from 5 seconds to 3.5 seconds after optimizing memory retrieval.
Error Rate Reduction: The error rate decreased from 12% to 3% after refining prompt templates and improving error handling.
Enhanced Debugging: Detailed trace logs helped identify edge-case inputs causing hallucinations. Iterative testing and adjustments based on LangSmith traces led to a more robust bot and improved customer satisfaction.
Future Trends & Next Steps
According to the latest LangChain roadmap, future enhancements in LangSmith include:
More Granular Metrics: Deeper insights at the micro-level of chain execution.
AI-Driven Diagnostics: Automated suggestions based on common error patterns.
Expanded Integrations: Better support for external observability platforms.
Improved Dataset Testing: Enhanced evaluation tools for continuous improvement.
Stay engaged with the community, monitor official documentation, and explore these features as they roll out.
Conclusion & Call to Action
Debugging and observability are essential for building reliable, scalable generative AI systems. LangSmith empowers you with tailored monitoring, detailed trace logging, and robust evaluation tools to optimize your workflows and quickly resolve issues.
Call to Action:
Try LangSmith: Integrate it into your next Gen AI project by setting up tracing via environment variables.
Learn More: Visit the official LangSmith documentation and join community discussions.
Share Your Experience: Provide feedback and share your project improvements with the hashtag #LangSmithDebugging.
By following these best practices and leveraging LangSmith’s powerful features, you’ll be well-equipped to enhance the reliability and performance of your AI workflows.
Contact me for any further discussion or service you need
abmishra1234@gmail.com | WhatsApp (+91) 9971003216


